Table of contents
Forecasting of sales by the Prophet
The aim was to create a model prediction of the sales for the next three weeks. Currently, the sales forecast is set 3 weeks ahead based on last week’s sales. The Weighted Absolute Percent Error (WAPE) is used for comparison purposes.
The whole dataset contains 3 CSV files.
The first is sales.csv: Data on product-level weekly sales.
- week_starting_date - the first day of the week date in format YYYYMMDD
- product_id - unique id for the product
- sales - weekly sales in pieces
The second is categories.csv: Data on which categories products are assigned to.
- product_id - unique id for the product
- category_id - unique id for category
The third is traffic.csv
- week_starting_date - the first day of the week date in format YYYYMMDD
- product_id - unique id for the product
- traffic - weekly product displays on the website
from google.colab import drive
drive.mount('/content/gdrive')
Mounted at /content/gdrive
sales.csv
import datetime
import pandas as pd
import numpy as np
sales = pd.read_csv('gdrive/My Drive/Prediction_task/sales.csv', sep=';')
sales.head()
| week_starting_date | product_id | sales | |
|---|---|---|---|
| 0 | 20191209 | 1990 | 1 |
| 1 | 20201123 | 1990 | 1 |
| 2 | 20201207 | 1990 | 1 |
| 3 | 20191202 | 1990 | 1 |
| 4 | 20201109 | 1990 | 2 |
Data cleaning
# Change week_starting_date to YYYY-DD-MM format
sales['week_starting_date'] = (sales['week_starting_date']
                               .apply(lambda x: pd.to_datetime(str(x), format='%Y%m%d')))
print(sales)
       week_starting_date  product_id  sales
0              2019-12-09        1990      1
1              2020-11-23        1990      1
2              2020-12-07        1990      1
3              2019-12-02        1990      1
4              2020-11-09        1990      2
...                   ...         ...    ...
105776         2020-10-05         567      9
105777         2020-09-28         567     16
105778         2020-12-07        2643      6
105779         2020-12-14        2643      5
105780         2020-11-30        2643     19

[105781 rows x 3 columns]
def fill_missing_data(df: pd.DataFrame, column: str) -> pd.DataFrame:
  """
  Fill in missing values. When there are missing sales for some date,
  the assumption is that there was no sale of the product.

  Input:
        df: pd.DataFrame,
        column: str
  Output:
        filled_missing_sales: pd.DataFrame
  """
  filled_missing_sales = df.set_index(
    ['week_starting_date', column]
  ).unstack(
      fill_value=0
  ).asfreq(
      'W-MON', fill_value=0
  ).stack().reset_index()

  return filled_missing_sales
filled_missing_sales = fill_missing_data(sales, 'product_id')
# Checking one of the product sales
new_df = filled_missing_sales.loc[filled_missing_sales['product_id'] == 48]
new_df = new_df[['week_starting_date', 'sales']]
print(new_df)
       week_starting_date  sales
43             2019-01-07      4
2969           2019-01-14      0
5895           2019-01-21     27
8821           2019-01-28     32
11747          2019-02-04      3
...                   ...    ...
289717         2020-11-30     30
292643         2020-12-07     25
295569         2020-12-14     50
298495         2020-12-21     32
301421         2020-12-28     28

[104 rows x 2 columns]
Create first prophet model for chosen product
# Import prophet to create model using this library
import fbprophet
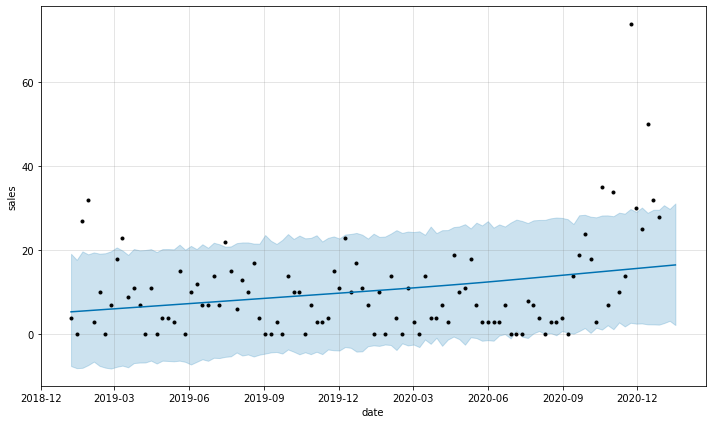
# Sample model for chosen product_id. By default prophet use linear model
m = fbprophet.Prophet()
new_df = new_df.rename(columns={'week_starting_date': 'ds', 'sales': 'y'})
m.fit(new_df)
# Forecast for following 3 weeks
future = m.make_future_dataframe(3, freq='W')
forecast = m.predict(future)
fig = m.plot(forecast, ylabel='sales', xlabel='date')
INFO:fbprophet:Disabling yearly seasonality. Run prophet with yearly_seasonality=True to override this.
INFO:fbprophet:Disabling weekly seasonality. Run prophet with weekly_seasonality=True to override this.
INFO:fbprophet:Disabling daily seasonality. Run prophet with daily_seasonality=True to override this.
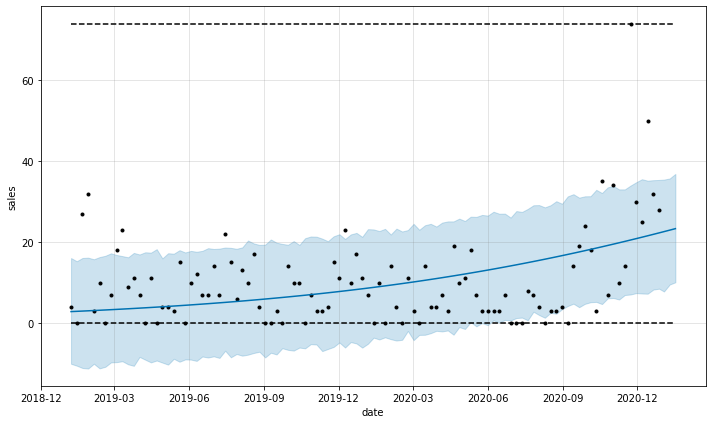
# Create model with logistic regression
m = fbprophet.Prophet(growth = 'logistic')
new_df = new_df.rename(columns={'week_starting_date': 'ds', 'sales': 'y'})

# Set floor and cap for the dataset and forecast in order to use logistic model
new_df['cap'] = max(new_df.y)
new_df['floor'] = 0
m.fit(new_df)
future = m.make_future_dataframe(3, freq='W')
future['cap'] = max(new_df.y)
future['floor'] = 0
forecast = m.predict(future)
fig = m.plot(forecast, ylabel='sales', xlabel='date')
INFO:fbprophet:Disabling yearly seasonality. Run prophet with yearly_seasonality=True to override this.
INFO:fbprophet:Disabling weekly seasonality. Run prophet with weekly_seasonality=True to override this.
INFO:fbprophet:Disabling daily seasonality. Run prophet with daily_seasonality=True to override this.
Further data cleaning
from datetime import datetime as dt
from datetime import timedelta as td

def remove_outliers(df: pd.DataFrame, item: str) -> pd.DataFrame:
  """
  Removing outliers by calculating 0.95 quantile per product

  Input: df: pd.DataFrame
         item: str
  Output: pd.DataFrame

  """

  today = filled_missing_sales.week_starting_date.max()
  delta = td(weeks=2)
  date_cutoff = today - delta
  date_cutoff = date_cutoff.strftime('%Y-%m-%d')

  # Get data from the beginning to the three weeks before the max of available date
  mask = (df['week_starting_date'] <date_cutoff)
  df_without_december = df.loc[mask]

  # Get data from last 3 weeks
  mask2 = (df['week_starting_date'] >= date_cutoff)
  df_with_december = df.loc[mask2]

  # Remove outliers from the "training" dataset
  q = (df_without_december.groupby('product_id')[item]
      .transform(lambda x: x.quantile(.95)))
  df_without_december = (
      df_without_december[df_without_december.sales <= q])

  # Concat cleaned training and test dataset
  frames = [df_without_december, df_with_december]
  result = pd.concat(frames)
  return result
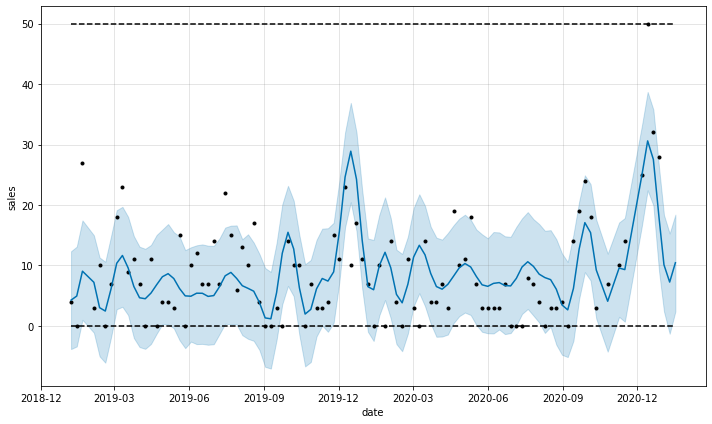
filled_missing_sales = remove_outliers(filled_missing_sales, 'sales')
# Plot of the dataset with removed outliers for chosen product_id
# and set yearly_seasonality=True

new_df = filled_missing_sales.loc[filled_missing_sales['product_id'] == 48]
new_df = new_df[['week_starting_date', 'sales']]

m = fbprophet.Prophet(yearly_seasonality=True, growth = 'logistic')
new_df = new_df.rename(columns={'week_starting_date': 'ds', 'sales': 'y'})
new_df['cap'] = max(new_df.y)
new_df['floor'] = 0
m.fit(new_df)
future = m.make_future_dataframe(3, freq='W')
future['cap'] = max(new_df.y)
future['floor'] = 0
forecast = m.predict(future)
fig = m.plot(forecast, ylabel='sales', xlabel='date')
INFO:fbprophet:Disabling weekly seasonality. Run prophet with weekly_seasonality=True to override this.
INFO:fbprophet:Disabling daily seasonality. Run prophet with daily_seasonality=True to override this.
Create models for all products
from fbprophet.diagnostics import performance_metrics, cross_validation

import random
import logging
logging.getLogger('fbprophet').setLevel(logging.WARNING)

def get_date_as_str(df: pd.DataFrame, week: int, type_return: str) -> str:
  """
  Get date based on ds column from the dataframe for chosen delta week

  Input:
        df: pd.DataFrame
        week: int
  Output:
        date_cutoff: str

  """
  date = df.ds.max()
  delta = td(weeks=week)
  date_cutoff = date - delta
  date_cutoff = date_cutoff.strftime('%Y-%m-%d')

  if type_return == 'type_datetime':
    date_cutoff = pd.to_datetime([str(date_cutoff)])

  return date_cutoff


def get_prediction(df: pd.DataFrame, seasonality_prior: int, cap_multiplier: int, changepoint_prior: int) -> dict:
    """
    Create prediction for products sales.
    In this model has been chosen short-term analysis of the data
    (16 weeks before the last available date).

    Input:
          df: pd.DataFrame
          seasonality_prior: int (multiplier of max cap)
          cap_multiplier: int (seasonality_prior_scale)
          changepoint_prior: int
    Output:
          prediction: dict
    """
    prediction = {}
    df = df.rename(columns={'week_starting_date': 'ds','sales': 'y', 'product_id': 'article'})
    list_articles = df.article.unique()

    random.seed(100)
    list_articles = random.sample(list(list_articles), 100)

    for article in list_articles:
        # To check model performance for first product_id, the break func
        # has been used

        #if article >= 200:
        #  break
        article_df = df.loc[df['article'] == article].copy()
        article_df['cap'] = cap_multiplier * max(article_df.y)
        article_df['floor'] = 0

        # Check if the cap is equal the floor
        if max(article_df.y) != 0:
          my_model = fbprophet.Prophet(weekly_seasonality=True,
                                       seasonality_prior_scale=seasonality_prior,
                                       changepoint_prior_scale=changepoint_prior,
                                       growth = 'logistic')

          # Filter date from 16 weeks of the last record to last record
          cutoffs = get_date_as_str(df = article_df,
                                    week = 16,
                                    type_return = "type_str")
          mask = (article_df['ds'] >=cutoffs)
          article_df = article_df.loc[mask]

          my_model.fit(article_df)

          #df_cv = cross_validation(my_model, initial='548 days', period='180 days', horizon = '21 days')
          #df_cv = cross_validation(my_model, initial='695 days', period='7 days', horizon = '21 days')

          # Set cutoff date 3 weeks of the last record
          cutoffs = get_date_as_str(df = article_df,
                                    week = 3,
                                    type_return = "type_datetime")
          df_cv = cross_validation(my_model,
                                   cutoffs=cutoffs,
                                   horizon='21 days',
                                   parallel="threads")

          # Round predicted values and replace if is negative
          df_cv.yhat = df_cv.yhat.round()
          df_cv.yhat = df_cv.yhat.mask(df_cv.yhat.lt(0),0)
          del my_model

        else:
          data = ([['2020-12-14', 0, 0],
                   ['2020-12-21', 0, 0],
                   ['2020-12-28', 0, 0]])
          df_cv = pd.DataFrame(data, columns = ['ds', 'y', 'yhat'])

        #future_dates = my_model.make_future_dataframe(periods=3, freq='W')
        #forecast = my_model.predict(future_dates)
        prediction[article] = df_cv

    return prediction
def calc_diffrenece_wape(df: dict, filled_missing_sales: pd.DataFrame):
  """
  Calculate the WAPE. For the prophet forecast, it is one subfunction, and the
  basic forecast is another subfunction. Basic forecast estimates the sales in
  next following three weeks will be on the same level as in the last week.

  There was also made one modification, that to the nominator and denominator
  have been added one, to avoid dividing by zero, so the WAPE values resulted
  from these functions will be different than in the original WAPE indicator.

  Input: df: dict
         filled_missing_sales: pd.DataFrame

  Output:
         len(predicted.keys()): int
         prophet_better: int

  """
  prophet_better = 0
  basic_better = 0
  same_results = 0

  def calc(df):
    table_wape = {}
    result_nom = 1
    result_denom = 1

    for i in range(0, len(df)):
      result_nom = result_nom + abs(df['yhat'][i]-df['y'][i])
      result_denom = result_denom + abs(df['y'][i])

    return  result_nom/result_denom

  def calc_original_df(df, j):
    df = (df.loc[(df.product_id == j) &
                 (df.week_starting_date>='2020-12-07'),
                 ['sales', 'week_starting_date']])
    table_wape = {}
    result_nom = 1
    result_denom = 1

    df = df.reset_index()

    for i in range(0, len(df)-1):
      result_nom = result_nom + abs(df['sales'][i+1]-df['sales'][i])
      result_denom = result_denom + abs(df['sales'][i+1])

    return result_nom/result_denom

  for j in predicted.keys():

    wape_prophet = calc(df[j])
    wape_original = calc_original_df(filled_missing_sales, j)
    #print(wape_prophet, wape_original)

    # Compare if the prophet wape ratio is not worse than for basic model
    if wape_prophet < wape_original:
      prophet_better+=1
    elif wape_prophet == wape_original:
      same_results+=1
    elif wape_prophet > wape_original:
      basic_better+=1

  return len(predicted.keys()), prophet_better, same_results, basic_better
Tuning hyperparameters
Parameters that can be tuned are available on the prophet website https://facebook.github.io/prophet/docs/diagnostics.html#hyperparameter-tuning
seasonality_prior=[0.01, 0.1, 1, 10]
cap_multiplier=[0.25, 0.5, 1]
changepoint_prior=[0.001, 0.01, 0.1, 0.5]

for selected_seasonality_prior in seasonality_prior:
  for selected_cap_multiplier in cap_multiplier:
    for selected_changepoint_prior in changepoint_prior:
      predicted = get_prediction(filled_missing_sales,
                                selected_seasonality_prior,
                                selected_cap_multiplier,
                                selected_changepoint_prior)
      products, prophet_better, same_results, basic_better = calc_diffrenece_wape(predicted, filled_missing_sales)
      print("Prophet achieved better result for " +
        str(round(prophet_better/products*100)) + "% of cases (WAPE performance metric)")
      print("Prophet achieved the same result for " +
        str(round(same_results/products*100)) + "% of cases (WAPE performance metric)")
      print("Prophet achieved worse result for " +
        str(round(basic_better/products*100)) + "% of cases (WAPE performance metric)")
Prophet achieved better result for 45% of cases (WAPE performance metric)
Prophet achieved the same result for 26% of cases (WAPE performance metric)
Prophet achieved worse result for 29% of cases (WAPE performance metric)
Prophet achieved better result for 47% of cases (WAPE performance metric)
Prophet achieved the same result for 23% of cases (WAPE performance metric)
Prophet achieved worse result for 30% of cases (WAPE performance metric)
Prophet achieved better result for 48% of cases (WAPE performance metric)
Prophet achieved the same result for 23% of cases (WAPE performance metric)
Prophet achieved worse result for 29% of cases (WAPE performance metric)
Prophet achieved better result for 48% of cases (WAPE performance metric)
Prophet achieved the same result for 24% of cases (WAPE performance metric)
Prophet achieved worse result for 28% of cases (WAPE performance metric)
Prophet achieved better result for 48% of cases (WAPE performance metric)
Prophet achieved the same result for 24% of cases (WAPE performance metric)
Prophet achieved worse result for 28% of cases (WAPE performance metric)
Prophet achieved better result for 48% of cases (WAPE performance metric)
Prophet achieved the same result for 23% of cases (WAPE performance metric)
Prophet achieved worse result for 29% of cases (WAPE performance metric)
Prophet achieved better result for 47% of cases (WAPE performance metric)
Prophet achieved the same result for 24% of cases (WAPE performance metric)
Prophet achieved worse result for 29% of cases (WAPE performance metric)
Prophet achieved better result for 47% of cases (WAPE performance metric)
Prophet achieved the same result for 24% of cases (WAPE performance metric)
Prophet achieved worse result for 29% of cases (WAPE performance metric)
Prophet achieved better result for 42% of cases (WAPE performance metric)
Prophet achieved the same result for 22% of cases (WAPE performance metric)
Prophet achieved worse result for 36% of cases (WAPE performance metric)
Prophet achieved better result for 38% of cases (WAPE performance metric)
Prophet achieved the same result for 24% of cases (WAPE performance metric)
Prophet achieved worse result for 38% of cases (WAPE performance metric)
Prophet achieved better result for 37% of cases (WAPE performance metric)
Prophet achieved the same result for 24% of cases (WAPE performance metric)
Prophet achieved worse result for 39% of cases (WAPE performance metric)
Prophet achieved better result for 36% of cases (WAPE performance metric)
Prophet achieved the same result for 25% of cases (WAPE performance metric)
Prophet achieved worse result for 39% of cases (WAPE performance metric)
Prophet achieved better result for 47% of cases (WAPE performance metric)
Prophet achieved the same result for 23% of cases (WAPE performance metric)
Prophet achieved worse result for 30% of cases (WAPE performance metric)
Prophet achieved better result for 45% of cases (WAPE performance metric)
Prophet achieved the same result for 27% of cases (WAPE performance metric)
Prophet achieved worse result for 28% of cases (WAPE performance metric)
Prophet achieved better result for 48% of cases (WAPE performance metric)
Prophet achieved the same result for 24% of cases (WAPE performance metric)
Prophet achieved worse result for 28% of cases (WAPE performance metric)
Prophet achieved better result for 48% of cases (WAPE performance metric)
Prophet achieved the same result for 24% of cases (WAPE performance metric)
Prophet achieved worse result for 28% of cases (WAPE performance metric)
Prophet achieved better result for 47% of cases (WAPE performance metric)
Prophet achieved the same result for 23% of cases (WAPE performance metric)
Prophet achieved worse result for 30% of cases (WAPE performance metric)
Prophet achieved better result for 44% of cases (WAPE performance metric)
Prophet achieved the same result for 28% of cases (WAPE performance metric)
Prophet achieved worse result for 28% of cases (WAPE performance metric)
Prophet achieved better result for 44% of cases (WAPE performance metric)
Prophet achieved the same result for 28% of cases (WAPE performance metric)
Prophet achieved worse result for 28% of cases (WAPE performance metric)
Prophet achieved better result for 44% of cases (WAPE performance metric)
Prophet achieved the same result for 29% of cases (WAPE performance metric)
Prophet achieved worse result for 27% of cases (WAPE performance metric)
Prophet achieved better result for 39% of cases (WAPE performance metric)
Prophet achieved the same result for 25% of cases (WAPE performance metric)
Prophet achieved worse result for 36% of cases (WAPE performance metric)
Prophet achieved better result for 38% of cases (WAPE performance metric)
Prophet achieved the same result for 24% of cases (WAPE performance metric)
Prophet achieved worse result for 38% of cases (WAPE performance metric)
Prophet achieved better result for 36% of cases (WAPE performance metric)
Prophet achieved the same result for 25% of cases (WAPE performance metric)
Prophet achieved worse result for 39% of cases (WAPE performance metric)
Prophet achieved better result for 36% of cases (WAPE performance metric)
Prophet achieved the same result for 24% of cases (WAPE performance metric)
Prophet achieved worse result for 40% of cases (WAPE performance metric)
Prophet achieved better result for 47% of cases (WAPE performance metric)
Prophet achieved the same result for 22% of cases (WAPE performance metric)
Prophet achieved worse result for 31% of cases (WAPE performance metric)
Prophet achieved better result for 45% of cases (WAPE performance metric)
Prophet achieved the same result for 23% of cases (WAPE performance metric)
Prophet achieved worse result for 32% of cases (WAPE performance metric)
Prophet achieved better result for 45% of cases (WAPE performance metric)
Prophet achieved the same result for 26% of cases (WAPE performance metric)
Prophet achieved worse result for 29% of cases (WAPE performance metric)
Prophet achieved better result for 46% of cases (WAPE performance metric)
Prophet achieved the same result for 26% of cases (WAPE performance metric)
Prophet achieved worse result for 28% of cases (WAPE performance metric)
Prophet achieved better result for 44% of cases (WAPE performance metric)
Prophet achieved the same result for 27% of cases (WAPE performance metric)
Prophet achieved worse result for 29% of cases (WAPE performance metric)
Prophet achieved better result for 41% of cases (WAPE performance metric)
Prophet achieved the same result for 27% of cases (WAPE performance metric)
Prophet achieved worse result for 32% of cases (WAPE performance metric)
Prophet achieved better result for 41% of cases (WAPE performance metric)
Prophet achieved the same result for 27% of cases (WAPE performance metric)
Prophet achieved worse result for 32% of cases (WAPE performance metric)
Prophet achieved better result for 41% of cases (WAPE performance metric)
Prophet achieved the same result for 28% of cases (WAPE performance metric)
Prophet achieved worse result for 31% of cases (WAPE performance metric)
Prophet achieved better result for 39% of cases (WAPE performance metric)
Prophet achieved the same result for 26% of cases (WAPE performance metric)
Prophet achieved worse result for 35% of cases (WAPE performance metric)
Prophet achieved better result for 38% of cases (WAPE performance metric)
Prophet achieved the same result for 24% of cases (WAPE performance metric)
Prophet achieved worse result for 38% of cases (WAPE performance metric)
Prophet achieved better result for 38% of cases (WAPE performance metric)
Prophet achieved the same result for 25% of cases (WAPE performance metric)
Prophet achieved worse result for 37% of cases (WAPE performance metric)
Prophet achieved better result for 38% of cases (WAPE performance metric)
Prophet achieved the same result for 26% of cases (WAPE performance metric)
Prophet achieved worse result for 36% of cases (WAPE performance metric)
Prophet achieved better result for 46% of cases (WAPE performance metric)
Prophet achieved the same result for 23% of cases (WAPE performance metric)
Prophet achieved worse result for 31% of cases (WAPE performance metric)
Reducing the upper limit by using a scaling parameter smaller than one, improved the WAPE index.
# Display some metrics generated by the cross_validation function
# eg. product_id=5
df_p = performance_metrics(predicted[5])
df_p
---------------------------------------------------------------------------

NameError                                 Traceback (most recent call last)

<ipython-input-2-cad13214df58> in <module>()
      3 # Display some metrics generated by the cross_validation function
      4 # eg. product_id=5
----> 5 df_p = performance_metrics(predicted[5])
      6 df_p


NameError: name 'predicted' is not defined
Unfortunately due to a killed session in colab after several hours of model validation, the individual parameters cannot be displayed from the ready-made performance_metrics function
If some product has insufficient sales data (for example it is some kind of new product in the store), take the period of sales per the category.
categories.csv
categories = pd.read_csv('gdrive/My Drive/Prediction_task/categories.csv', sep=';')
categories.head()
| product_id | category_id | |
|---|---|---|
| 0 | 1990 | 0 |
| 1 | 2361 | 1 |
| 2 | 1085 | 2 |
| 3 | 3091 | 3 |
| 4 | 955 | 4 |
Investigation of the categories dataset
categories_agg = (categories[['product_id', 'category_id']]
                  .groupby(['category_id'])
                  .agg(['count']))
categories_agg
| product_id | |
|---|---|
| count | |
| category_id | |
| 0 | 35 |
| 1 | 22 |
| 2 | 57 |
| 3 | 26 |
| 4 | 165 |
| ... | ... |
| 87 | 2 |
| 88 | 1 |
| 89 | 3 |
| 90 | 1 |
| 91 | 1 |
92 rows × 1 columns
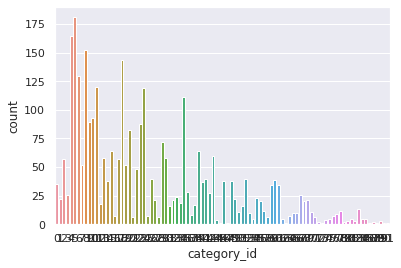
import seaborn as sns
sns.set_theme(style="darkgrid")
ax = sns.countplot(x="category_id", data=categories)
joined_df = filled_missing_sales.merge(categories)
joined_df.head()
| week_starting_date | product_id | sales | category_id | |
|---|---|---|---|---|
| 0 | 2019-01-07 | 1 | 0 | 10 |
| 1 | 2019-01-14 | 1 | 0 | 10 |
| 2 | 2019-01-21 | 1 | 0 | 10 |
| 3 | 2019-01-28 | 1 | 0 | 10 |
| 4 | 2019-02-04 | 1 | 0 | 10 |
grouped_joined_df = (joined_df
                     .groupby(['week_starting_date','category_id'])
                     ['sales'].sum().reset_index())
grouped_joined_df
| week_starting_date | category_id | sales | |
|---|---|---|---|
| 0 | 2019-01-07 | 0 | 38 |
| 1 | 2019-01-07 | 1 | 44 |
| 2 | 2019-01-07 | 2 | 68 |
| 3 | 2019-01-07 | 3 | 47 |
| 4 | 2019-01-07 | 4 | 237 |
| ... | ... | ... | ... |
| 9522 | 2020-12-28 | 87 | 0 |
| 9523 | 2020-12-28 | 88 | 0 |
| 9524 | 2020-12-28 | 89 | 0 |
| 9525 | 2020-12-28 | 90 | 0 |
| 9526 | 2020-12-28 | 91 | 0 |
9527 rows × 3 columns
def get_prediction_category(df: pd.DataFrame) -> dict:
  """
  Create prediction for category sales

  Input:
        df: pd.DataFrame
  Output:
        prediction: dict
    """
  prediction = {}
  df = df.rename(columns={'week_starting_date': 'ds',
                          'sales': 'y',
                          'category_id': 'category'})
  list_categories = df.category.unique()

  for category in list_categories:

      category_df = df.loc[df['category'] == category].copy()
      category_df['cap'] = 0.5 * max(category_df.y)
      category_df['floor'] = 0

      if max(category_df.y)!=0:
        my_model = fbprophet.Prophet(yearly_seasonality=True,
                                    seasonality_prior_scale=1.0,
                                      growth = 'logistic')
        my_model.fit(category_df)
        #df_cv = cross_validation(my_model, initial='548 days', period='180 days', horizon = '21 days')
        #df_cv = cross_validation(my_model, initial='695 days', period='7 days', horizon = '21 days')

        # Set cutoff date 3 weeks of the last record
        cutoffs = get_date_as_str(df = category_df,
                                  week = 3,
                                  type_return = "type_datetime")
        df_cv = cross_validation(my_model, cutoffs=cutoffs, horizon='21 days')

        # replace less than 0 values and round it
        df_cv.yhat = df_cv.yhat.round()
        df_cv.yhat = df_cv.yhat.mask(df_cv.yhat.lt(0),0)

        #future_dates = my_model.make_future_dataframe(periods=3, freq='W')
        #forecast = my_model.predict(future_dates)
        prediction[category] = df_cv
        del my_model
      else:
          data = ([['2020-12-14', 0, 0],
                   ['2020-12-21', 0, 0],
                   ['2020-12-28', 0, 0]])
          df_cv = pd.DataFrame(data, columns = ['ds', 'y', 'yhat'])

  return prediction

predicted_joined = get_prediction_category(grouped_joined_df)
traffic.csv
traffic = pd.read_csv('gdrive/My Drive/Prediction_task/traffic.csv', sep=';')
traffic['week_starting_date'] = (traffic['week_starting_date']
                                 .apply(lambda x: pd.to_datetime(str(x), format='%Y%m%d')))
traffic.head()
| week_starting_date | product_id | traffic | |
|---|---|---|---|
| 0 | 2019-01-07 | 1990 | 1 |
| 1 | 2019-01-07 | 2361 | 7 |
| 2 | 2019-01-07 | 1085 | 1 |
| 3 | 2019-01-07 | 3091 | 4 |
| 4 | 2019-01-07 | 955 | 12 |
sales_filled = fill_missing_data(sales, 'product_id')
new_df_merged = pd.merge(sales_filled,
                         traffic,
                         how='outer',
                         left_on=['week_starting_date','product_id'],
                         right_on = ['week_starting_date','product_id'])
new_df_merged
| week_starting_date | product_id | sales | traffic | |
|---|---|---|---|---|
| 0 | 2019-01-07 | 1 | 0.0 | NaN |
| 1 | 2019-01-07 | 2 | 0.0 | NaN |
| 2 | 2019-01-07 | 3 | 0.0 | NaN |
| 3 | 2019-01-07 | 4 | 0.0 | NaN |
| 4 | 2019-01-07 | 5 | 0.0 | NaN |
| ... | ... | ... | ... | ... |
| 304388 | 2020-12-14 | 1105 | NaN | 1.0 |
| 304389 | 2020-12-21 | 831 | NaN | 1.0 |
| 304390 | 2020-12-21 | 1203 | NaN | 1.0 |
| 304391 | 2020-12-21 | 2540 | NaN | 1.0 |
| 304392 | 2020-12-28 | 831 | NaN | 1.0 |
304393 rows × 4 columns
Data cleaning
new_df_merged['traffic'] = new_df_merged['traffic'].fillna(0).astype(int)
new_df_merged['sales'] = new_df_merged['sales'].fillna(0).astype(int)
new_df_merged
| week_starting_date | product_id | sales | traffic | |
|---|---|---|---|---|
| 0 | 2019-01-07 | 1 | 0 | 0 |
| 1 | 2019-01-07 | 2 | 0 | 0 |
| 2 | 2019-01-07 | 3 | 0 | 0 |
| 3 | 2019-01-07 | 4 | 0 | 0 |
| 4 | 2019-01-07 | 5 | 0 | 0 |
| ... | ... | ... | ... | ... |
| 304388 | 2020-12-14 | 1105 | 0 | 1 |
| 304389 | 2020-12-21 | 831 | 0 | 1 |
| 304390 | 2020-12-21 | 1203 | 0 | 1 |
| 304391 | 2020-12-21 | 2540 | 0 | 1 |
| 304392 | 2020-12-28 | 831 | 0 | 1 |
304393 rows × 4 columns
merged_df_without_removed_outliers = new_df_merged.copy()
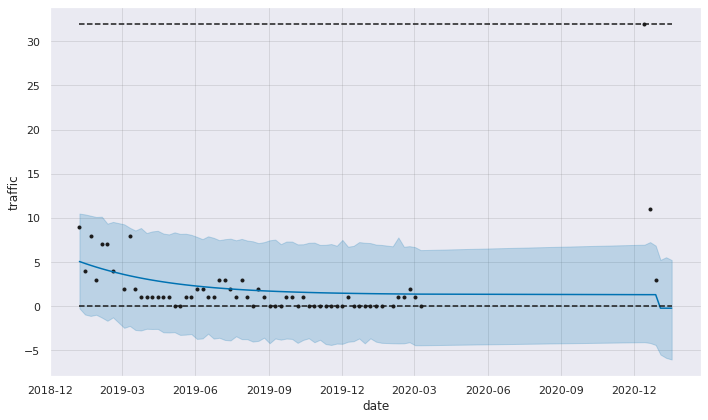
Awareness of removing outliers
For some data, the removing is quite agressive, and cause the model error in fitting.
new_df = merged_df_without_removed_outliers.loc[merged_df_without_removed_outliers['product_id'] == 45]

m = fbprophet.Prophet(growth='logistic')
#m.add_regressor('traffic')
new_df = new_df.rename(columns={'week_starting_date': 'ds', 'traffic': 'y'})
new_df['cap'] = max(new_df.y)
new_df['floor'] = 0
m.fit(new_df)
future = m.make_future_dataframe(3, freq='W')
future['cap'] = max(new_df.y)
future['floor'] = 0
fcst1 = m.predict(future)
fig1 = m.plot(fcst1, ylabel='traffic', xlabel='date')
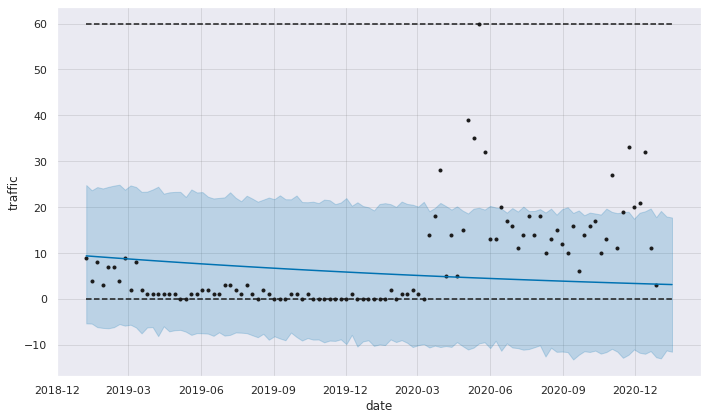
# Removing outliers by calculating 0.95 quantile per product

new_df_merged_filled_zeros = remove_outliers(merged_df_without_removed_outliers, 'traffic')
new_df_merged_filled_zeros.loc[new_df_merged_filled_zeros['product_id'] == 45]
| week_starting_date | product_id | sales | traffic | |
|---|---|---|---|---|
| 40 | 2019-01-07 | 45 | 18 | 9 |
| 2966 | 2019-01-14 | 45 | 22 | 4 |
| 5892 | 2019-01-21 | 45 | 15 | 8 |
| 8818 | 2019-01-28 | 45 | 24 | 3 |
| 11744 | 2019-02-04 | 45 | 13 | 7 |
| ... | ... | ... | ... | ... |
| 175600 | 2020-03-02 | 45 | 9 | 1 |
| 178526 | 2020-03-09 | 45 | 20 | 0 |
| 295566 | 2020-12-14 | 45 | 147 | 32 |
| 298492 | 2020-12-21 | 45 | 56 | 11 |
| 301418 | 2020-12-28 | 45 | 4 | 3 |
63 rows × 4 columns
# Using the same parameters, but with removed outliers
new_df = new_df_merged_filled_zeros.loc[new_df_merged_filled_zeros['product_id'] == 45]

m = fbprophet.Prophet(growth='logistic')
#m.add_regressor('traffic')
new_df = new_df.rename(columns={'week_starting_date': 'ds', 'traffic': 'y'})
new_df['cap'] = max(new_df.y)
new_df['floor'] = 0
m.fit(new_df)
future = m.make_future_dataframe(3, freq='W')
future['cap'] = max(new_df.y)
future['floor'] = 0
fcst1 = m.predict(future)
fig1 = m.plot(fcst1, ylabel='traffic', xlabel='date')
WARNING:fbprophet.models:Optimization terminated abnormally. Falling back to Newton.


---------------------------------------------------------------------------

RuntimeError                              Traceback (most recent call last)

/usr/local/lib/python3.7/dist-packages/fbprophet/models.py in fit(self, stan_init, stan_data, **kwargs)
    244         try:
--> 245             self.stan_fit = self.model.optimizing(**args)
    246         except RuntimeError:


/usr/local/lib/python3.7/dist-packages/pystan/model.py in optimizing(self, data, seed, init, sample_file, algorithm, verbose, as_vector, **kwargs)
    580
--> 581         ret, sample = fit._call_sampler(stan_args)
    582         pars = pystan.misc._par_vector2dict(sample['par'], m_pars, p_dims)


stanfit4anon_model_dfdaf2b8ece8a02eb11f050ec701c0ec_4165267599802363488.pyx in stanfit4anon_model_dfdaf2b8ece8a02eb11f050ec701c0ec_4165267599802363488.StanFit4Model._call_sampler()


stanfit4anon_model_dfdaf2b8ece8a02eb11f050ec701c0ec_4165267599802363488.pyx in stanfit4anon_model_dfdaf2b8ece8a02eb11f050ec701c0ec_4165267599802363488._call_sampler()


RuntimeError: Exception: Exception: multiply: B[1] is -nan, but must not be nan!  (in 'unknown file name' at line 61)
  (in 'unknown file name' at line 121)


During handling of the above exception, another exception occurred:


RuntimeError                              Traceback (most recent call last)

<ipython-input-46-7b5b9ed0a54e> in <module>()
      7 new_df['cap'] = max(new_df.y)
      8 new_df['floor'] = 0
----> 9 m.fit(new_df)
     10 future = m.make_future_dataframe(3, freq='W')
     11 future['cap'] = max(new_df.y)


/usr/local/lib/python3.7/dist-packages/fbprophet/forecaster.py in fit(self, df, **kwargs)
   1164             self.params = self.stan_backend.sampling(stan_init, dat, self.mcmc_samples, **kwargs)
   1165         else:
-> 1166             self.params = self.stan_backend.fit(stan_init, dat, **kwargs)
   1167
   1168         # If no changepoints were requested, replace delta with 0s


/usr/local/lib/python3.7/dist-packages/fbprophet/models.py in fit(self, stan_init, stan_data, **kwargs)
    250             )
    251             args['algorithm'] = 'Newton'
--> 252             self.stan_fit = self.model.optimizing(**args)
    253
    254         params = dict()


/usr/local/lib/python3.7/dist-packages/pystan/model.py in optimizing(self, data, seed, init, sample_file, algorithm, verbose, as_vector, **kwargs)
    579         stan_args = pystan.misc._get_valid_stan_args(stan_args)
    580
--> 581         ret, sample = fit._call_sampler(stan_args)
    582         pars = pystan.misc._par_vector2dict(sample['par'], m_pars, p_dims)
    583         if not as_vector:


stanfit4anon_model_dfdaf2b8ece8a02eb11f050ec701c0ec_4165267599802363488.pyx in stanfit4anon_model_dfdaf2b8ece8a02eb11f050ec701c0ec_4165267599802363488.StanFit4Model._call_sampler()


stanfit4anon_model_dfdaf2b8ece8a02eb11f050ec701c0ec_4165267599802363488.pyx in stanfit4anon_model_dfdaf2b8ece8a02eb11f050ec701c0ec_4165267599802363488._call_sampler()


RuntimeError: Exception: Exception: multiply: B[1] is -nan, but must not be nan!  (in 'unknown file name' at line 61)
  (in 'unknown file name' at line 121)
Let’s try to “repair” the model by using different parameter
# Using weekly_seasonality=True parameter, but with removed outliers
new_df = new_df_merged_filled_zeros.loc[new_df_merged_filled_zeros['product_id'] == 45]

m = fbprophet.Prophet(weekly_seasonality=True, growth='logistic')
#m.add_regressor('traffic')
new_df = new_df.rename(columns={'week_starting_date': 'ds', 'traffic': 'y'})
new_df['cap'] = max(new_df.y)
new_df['floor'] = 0
m.fit(new_df)
future = m.make_future_dataframe(3, freq='W')
future['cap'] = max(new_df.y)
future['floor'] = 0
fcst1 = m.predict(future)
fig1 = m.plot(fcst1, ylabel='traffic', xlabel='date')
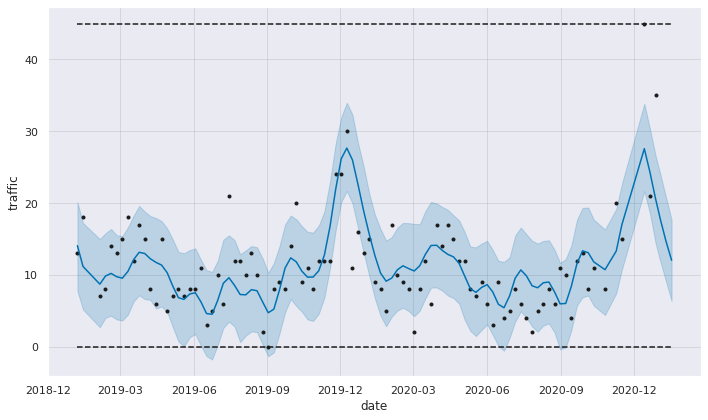
Create first traffic model for chosen product
new_df = new_df_merged_filled_zeros.loc[new_df_merged_filled_zeros['product_id'] == 48]

m = fbprophet.Prophet(yearly_seasonality=True, growth='logistic')
#m.add_regressor('traffic')
new_df = new_df.rename(columns={'week_starting_date': 'ds', 'traffic': 'y'})
new_df['cap'] = max(new_df.y)
new_df['floor'] = 0
m.fit(new_df)
future = m.make_future_dataframe(3, freq='W')
future['cap'] = max(new_df.y)
future['floor'] = 0
fcst1 = m.predict(future)
fig1 = m.plot(fcst1, ylabel='traffic', xlabel='date')
def get_prediction_traffic(df: pd.DataFrame) -> dict:
  """
  Create prediction for products traffic

  Input:
        df: pd.DataFrame
  Output:
        prediction: dict
  """
  prediction = {}
  df = df.rename(columns={'week_starting_date': 'ds','traffic': 'y', 'product_id': 'article'})
  list_articles = df.article.unique()

  for article in list_articles:
    if article >= 40:
      break
    article_df = df.loc[df['article'] == article].copy()
    article_df['cap'] = max(article_df.y)
    article_df['floor'] = 0

    # Check if the cap is equal the floor
    if max(article_df.y) != 0:
      my_model = fbprophet.Prophet(weekly_seasonality=True,
                                  seasonality_prior_scale=0.1,
                                  growth = 'logistic')

      # Filter date from 16 weeks of the last record to last record
      # Set cutoff date 3 weeks of the last record
      cutoffs = get_date_as_str(df = article_df,
                                week = 16,
                                type_return = "type_str")
      mask = (article_df['ds'] >=cutoffs)
      article_df = article_df.loc[mask]

      my_model.fit(article_df)
      #df_cv = cross_validation(my_model, initial='548 days', period='180 days', horizon = '21 days')
      #df_cv = cross_validation(my_model, initial='695 days', period='7 days', horizon = '21 days')

      # Set cutoff date 3 weeks of the last record
      cutoffs = get_date_as_str(df = article_df,
                                week = 3,
                                type_return = "type_datetime")
      df_cv = cross_validation(my_model,
                                cutoffs=cutoffs,
                                horizon='21 days',
                                parallel="processes")

      # Round predicted values and replace if is negative
      df_cv.yhat = df_cv.yhat.round()
      df_cv.yhat = df_cv.yhat.mask(df_cv.yhat.lt(0),0)
      del my_model

    else:
      data = ([['2020-12-14', 0, 0],
              ['2020-12-21', 0, 0],
              ['2020-12-28', 0, 0]])
      df_cv = pd.DataFrame(data, columns = ['ds', 'y', 'yhat'])

    #future_dates = my_model.make_future_dataframe(periods=3, freq='W')
    #forecast = my_model.predict(future_dates)
    prediction[article] = df_cv

  return prediction

predicted = get_prediction_traffic(new_df_merged_filled_zeros)
predicted
{1:           ds  yhat    yhat_lower    yhat_upper  y     cutoff
 0 2020-12-14  -0.0 -3.314623e-13  2.645080e-13  0 2020-12-07
 1 2020-12-21   0.0 -2.904974e-13  3.490215e-13  0 2020-12-07
 2 2020-12-28   0.0 -2.860131e-13  3.413645e-13  0 2020-12-07,
 2:           ds   yhat  yhat_lower  yhat_upper    y     cutoff
 0 2020-12-14  830.0  794.459264  869.223777  736 2020-12-07
 1 2020-12-21  875.0  836.340372  914.276887  147 2020-12-07
 2 2020-12-28  903.0  865.593979  941.569269   81 2020-12-07,
 3:           ds  yhat  yhat_lower  yhat_upper   y     cutoff
 0 2020-12-14  35.0   33.147280   37.067659  14 2020-12-07
 1 2020-12-21  53.0   51.047349   55.267420  22 2020-12-07
 2 2020-12-28  78.0   76.378858   80.549221  19 2020-12-07,
 4:           ds  yhat    yhat_lower    yhat_upper  y     cutoff
 0 2020-12-14   0.0 -2.273963e-13  3.414365e-13  0 2020-12-07
 1 2020-12-21  -0.0 -3.405071e-13  2.718099e-13  0 2020-12-07
 2 2020-12-28  -0.0 -3.044627e-13  3.006419e-13  0 2020-12-07,
 5:           ds  yhat  yhat_lower  yhat_upper   y     cutoff
 0 2020-12-14  22.0   21.513397   21.513397  26 2020-12-07
 1 2020-12-21  22.0   22.271891   22.271891   6 2020-12-07
 2 2020-12-28  23.0   22.977895   22.977896  10 2020-12-07,
 6:           ds  yhat  yhat_lower  yhat_upper   y     cutoff
 0 2020-12-14  55.0   51.653314   57.647132  32 2020-12-07
 1 2020-12-21  74.0   70.601456   77.053469  29 2020-12-07
 2 2020-12-28  95.0   91.798615   98.174632  35 2020-12-07,
 7:           ds  yhat  yhat_lower  yhat_upper  y     cutoff
 0 2020-12-14   2.0    0.798409    4.190442  3 2020-12-07
 1 2020-12-21   2.0    0.721176    4.372512  1 2020-12-07
 2 2020-12-28   2.0    0.608879    4.217207  1 2020-12-07,
 8:           ds  yhat  yhat_lower  yhat_upper  y     cutoff
 0 2020-12-14  12.0    6.492838   19.032102  0 2020-12-07
 1 2020-12-21  14.0    7.711896   20.745267  0 2020-12-07
 2 2020-12-28  15.0    8.862105   21.569205  0 2020-12-07,
 9:           ds  yhat  yhat_lower  yhat_upper  y     cutoff
 0 2020-12-14   9.0    4.960243   12.924439  8 2020-12-07
 1 2020-12-21   9.0    5.033804   13.311828  4 2020-12-07
 2 2020-12-28   9.0    5.019805   13.090601  1 2020-12-07,
 10:           ds  yhat  yhat_lower  yhat_upper   y     cutoff
 0 2020-12-14   4.0    1.551638    7.166948  46 2020-12-07
 1 2020-12-21   5.0    1.916118    7.364264  19 2020-12-07
 2 2020-12-28   5.0    1.990993    7.650544   0 2020-12-07,
 11:           ds  yhat  yhat_lower  yhat_upper   y     cutoff
 0 2020-12-14  50.0   41.839691   57.891207  17 2020-12-07
 1 2020-12-21  55.0   47.522832   64.206855  13 2020-12-07
 2 2020-12-28  61.0   52.750043   69.016407  36 2020-12-07,
 12:           ds  yhat  yhat_lower  yhat_upper  y     cutoff
 0 2020-12-14   1.0   -0.319330    1.360013  0 2020-12-07
 1 2020-12-21   1.0   -0.363180    1.385458  0 2020-12-07
 2 2020-12-28   0.0   -0.369094    1.314520  0 2020-12-07,
 13:           ds  yhat  yhat_lower  yhat_upper  y     cutoff
 0 2020-12-14   9.0    7.638626    9.993248  8 2020-12-07
 1 2020-12-21  10.0    8.619146   11.153766  3 2020-12-07
 2 2020-12-28  11.0    9.657735   12.162501  7 2020-12-07,
 14:           ds  yhat  yhat_lower  yhat_upper  y     cutoff
 0 2020-12-14   8.0    2.894972   13.330127  2 2020-12-07
 1 2020-12-21   8.0    2.997946   14.230813  0 2020-12-07
 2 2020-12-28   9.0    2.994879   14.095436  1 2020-12-07,
 15:           ds   yhat  yhat_lower  yhat_upper   y     cutoff
 0 2020-12-14   96.0   61.003090  129.902303  77 2020-12-07
 1 2020-12-21   99.0   66.243308  134.836657  17 2020-12-07
 2 2020-12-28  101.0   65.724479  133.909778  29 2020-12-07,
 16:           ds  yhat  yhat_lower  yhat_upper   y     cutoff
 0 2020-12-14  10.0    8.978201   10.776055   6 2020-12-07
 1 2020-12-21  11.0    9.777220   11.706446  10 2020-12-07
 2 2020-12-28  11.0   10.227846   12.120446  10 2020-12-07,
 17:           ds  yhat  yhat_lower  yhat_upper   y     cutoff
 0 2020-12-14  17.0    3.075580   31.353102   7 2020-12-07
 1 2020-12-21  17.0    3.515071   32.906864  18 2020-12-07
 2 2020-12-28  18.0    3.649959   32.305973  20 2020-12-07,
 19:           ds  yhat  yhat_lower  yhat_upper   y     cutoff
 0 2020-12-14  22.0   14.911196   29.806150  24 2020-12-07
 1 2020-12-21  23.0   15.233583   30.895302  11 2020-12-07
 2 2020-12-28  24.0   16.479201   31.870288   8 2020-12-07,
 20:           ds  yhat  yhat_lower  yhat_upper   y     cutoff
 0 2020-12-14   5.0    1.601734    7.943625  11 2020-12-07
 1 2020-12-21   3.0    0.338973    6.611043   4 2020-12-07
 2 2020-12-28   3.0   -0.570450    5.801675   2 2020-12-07,
 21:           ds  yhat  yhat_lower  yhat_upper   y     cutoff
 0 2020-12-14   8.0    5.568788   10.488612  14 2020-12-07
 1 2020-12-21   8.0    5.872692   11.168610   2 2020-12-07
 2 2020-12-28   9.0    6.136933   11.370472   8 2020-12-07,
 22:           ds  yhat  yhat_lower  yhat_upper  y     cutoff
 0 2020-12-14   1.0   -1.117006    2.668953  5 2020-12-07
 1 2020-12-21   1.0   -1.315457    2.665397  0 2020-12-07
 2 2020-12-28   1.0   -1.276621    2.635443  0 2020-12-07,
 23:           ds  yhat  yhat_lower  yhat_upper  y     cutoff
 0 2020-12-14  -0.0   -2.393039    1.829387  2 2020-12-07
 1 2020-12-21  -0.0   -2.541668    2.003540  0 2020-12-07
 2 2020-12-28  -0.0   -2.714260    1.777411  0 2020-12-07,
 24:           ds  yhat  yhat_lower  yhat_upper  y     cutoff
 0 2020-12-14   1.0   -0.372922    2.644378  3 2020-12-07
 1 2020-12-21   1.0   -0.459426    2.788531  0 2020-12-07
 2 2020-12-28   1.0   -0.574293    2.635407  3 2020-12-07,
 25:           ds  yhat  yhat_lower  yhat_upper  y     cutoff
 0 2020-12-14  14.0   10.994052   16.083686  9 2020-12-07
 1 2020-12-21  14.0   11.444107   16.922816  5 2020-12-07
 2 2020-12-28  15.0   11.811661   17.225838  4 2020-12-07,
 26:           ds  yhat  yhat_lower  yhat_upper  y     cutoff
 0 2020-12-14   0.0   -0.217918    0.444932  0 2020-12-07
 1 2020-12-21   0.0   -0.215928    0.473042  2 2020-12-07
 2 2020-12-28   0.0   -0.219867    0.451856  3 2020-12-07,
 27:           ds  yhat    yhat_lower    yhat_upper  y     cutoff
 0 2020-12-14  -0.0 -1.417694e-13  5.899911e-14  7 2020-12-07
 1 2020-12-21   0.0 -8.416815e-14  1.170978e-13  0 2020-12-07
 2 2020-12-28   0.0 -7.557096e-14  1.312115e-13  0 2020-12-07,
 28:           ds  yhat  yhat_lower  yhat_upper   y     cutoff
 0 2020-12-14  10.0    9.515788   10.598433  13 2020-12-07
 1 2020-12-21  11.0   10.313969   11.392127   2 2020-12-07
 2 2020-12-28  11.0   10.896219   11.947059   1 2020-12-07,
 29:           ds  yhat  yhat_lower  yhat_upper   y     cutoff
 0 2020-12-14   0.0   -7.185052   -1.912559  63 2020-12-07
 1 2020-12-21   0.0   -7.486661   -2.053196  18 2020-12-07
 2 2020-12-28   0.0   -7.507756   -1.908504   0 2020-12-07,
 30:           ds  yhat  yhat_lower  yhat_upper  y     cutoff
 0 2020-12-14   7.0    3.507970    9.785503  6 2020-12-07
 1 2020-12-21   7.0    3.299814   10.057230  3 2020-12-07
 2 2020-12-28   6.0    3.028469    9.706291  6 2020-12-07,
 32:            ds  y  yhat
 0  2020-12-14  0     0
 1  2020-12-21  0     0
 2  2020-12-28  0     0,
 33:           ds  yhat  yhat_lower  yhat_upper  y     cutoff
 0 2020-12-14   3.0    0.537796    5.481520  6 2020-12-07
 1 2020-12-21   3.0    0.424975    5.729947  0 2020-12-07
 2 2020-12-28   3.0    0.394756    5.599013  2 2020-12-07,
 34:           ds  yhat  yhat_lower  yhat_upper  y     cutoff
 0 2020-12-14   1.0   -0.451206    2.926333  3 2020-12-07
 1 2020-12-21   1.0   -0.409944    2.866366  0 2020-12-07
 2 2020-12-28   1.0   -0.302364    2.931885  3 2020-12-07,
 37:           ds  yhat  yhat_lower  yhat_upper   y     cutoff
 0 2020-12-14   2.0   -0.242928    3.351227  11 2020-12-07
 1 2020-12-21   2.0   -0.092053    3.760037   0 2020-12-07
 2 2020-12-28   2.0   -0.046679    3.762158   1 2020-12-07,
 38:           ds  yhat  yhat_lower  yhat_upper  y     cutoff
 0 2020-12-14   0.0   -0.979372    1.605552  0 2020-12-07
 1 2020-12-21   0.0   -1.081830    1.609755  0 2020-12-07
 2 2020-12-28   0.0   -1.121827    1.469671  0 2020-12-07,
 39:           ds  yhat  yhat_lower  yhat_upper   y     cutoff
 0 2020-12-14  57.0   49.005293   64.512700  23 2020-12-07
 1 2020-12-21  63.0   55.126692   71.819543   8 2020-12-07
 2 2020-12-28  67.0   58.849911   75.346128  10 2020-12-07}
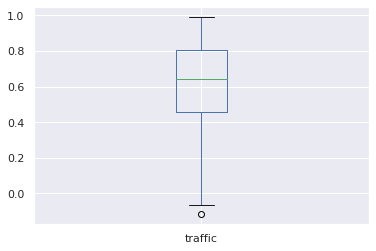
Check correlation betweeen sales and traffic
original_df_corr = (merged_df_without_removed_outliers
                    .groupby('product_id')
                    [['sales','traffic']].corr().iloc[0::2,-1])
original_df_corr.plot.box()
<matplotlib.axes._subplots.AxesSubplot at 0x7f89c665ce90>
shifted_df = merged_df_without_removed_outliers.copy()
shifted_df['sales'] = shifted_df.groupby('product_id')['sales'].shift().fillna(0)
corr_df = shifted_df.groupby('product_id')[['sales','traffic']].corr().iloc[0::2,-1]
corr_df.plot.box()
<matplotlib.axes._subplots.AxesSubplot at 0x7f89c65a8490>
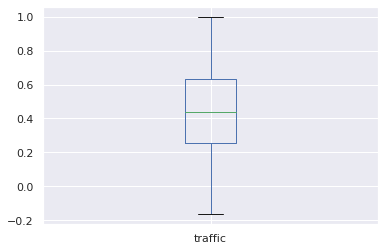
Based on the results, there is a lower correlation (median <0.5) if the sales column values are shifted down (than without shifted values). That means we could not have a higher chance that viewers on the website can buy a product in the next week.
Conclusions
Recommendations for estimating future sales:
- If the article is not available at a warehouse and the local branches do not have this article, the forecast should be set to zero. For us it is obvious, but for the model, it is unknown that our supplier does not have such a product.
- If the product sales for six weeks before are equal to zero, the forecast should be set to zero. This range has been chosen arbitrarily.
- When a new product is in our store, we can make some estimations by using category and compare to the same level price products from the same category.
- Campaign marketing actions should be considered when the forecast is evaluated. It is known that the advertisements give more chance for the client’s choice of buying product.
- Based on the observations for some products, the modeling should be done in two ways: by using yearly_seasonality for the whole data from two years and weekly_seasonality for the short data range (it could be last X months)
import sys
print(sys.version)
3.7.10 (default, May  3 2021, 02:48:31)
[GCC 7.5.0]
pip freeze --local > /content/gdrive/My\ Drive/Prediction_task/colab_installed.txt